Integration monitoring dashboard
Overview
Note: Integration monitoring is rolling out to select workspaces. If you don't see it, it isn't enabled for your account yet.
The integration monitoring dashboard lets you monitor the health of your procurement integrations, triage failures, and inspect what Ramp sent to and received from connected systems — all in one place. It covers accounting and ERP syncs, contract and third-party-risk management (TPRM) connectors, and eSign connectors.
The dashboard is available to workspace Admins who have the manage integrations permission. It isn't available to standalone AI spend users. The dashboard monitors integrations only — to connect an integration, map fields, or manage credentials, use App Center as you do today.
Where to find the dashboard
You can open the dashboard from two places:
- Go to the integration monitoring dashboard in your integration settings.
- From the Workflows home page, select Integration monitoring in the top right — it opens the same dashboard.
Supported integrations and actions
Each integration can run multiple actions, and the dashboard tracks each action separately. Support is by action across every connector that offers it, so the actions you see depend on which integrations you've set up and what each one supports — not every ERP or connector exposes every action.
Procurement coverage includes Ironclad for launching contract lifecycle management (CLM) workflows; DocuSign and Dropbox Sign for sending eSign envelopes; Vanta, LogicGate, OneTrust, and Drata for initiating third-party risk management (TPRM) vendor reviews; and Jira, Asana, Linear, and Zendesk for creating tickets.
| Category | Action name | Providers |
|---|---|---|
| CLM | Launch CLM workflow | Ironclad |
| eSign | Send eSign envelope | DocuSign, Dropbox Sign |
| TPRM | Initiate vendor review | Vanta, LogicGate, OneTrust, Drata |
| Ticketing | Create ticket | Jira, Asana, Linear, Zendesk |
For ERP and accounting integrations, vendor sync is available for QuickBooks Online, Xero, Sage Intacct, NetSuite, Acumatica, and Oracle Fusion Cloud Financials. Purchase order sync is available for QuickBooks Online, NetSuite, Microsoft Dynamics 365 Business Central, Sage Intacct, and Oracle Fusion Cloud Financials.
| Sync type | Providers |
|---|---|
| Vendor sync | QuickBooks Online, Xero, Sage Intacct, NetSuite, Acumatica, Oracle Fusion Cloud Financials |
| Purchase order sync | QuickBooks Online, NetSuite, Microsoft Dynamics 365 Business Central, Sage Intacct, Oracle Fusion Cloud Financials |
For setup instructions for DocuSign and Vanta, see Set up Ramp's DocuSign integration and Connect and use the Vanta integration for security reviews.
What the dashboard shows
The dashboard summarizes integration health for the selected time range. This section is explanatory — you don't need to navigate anywhere to read it.
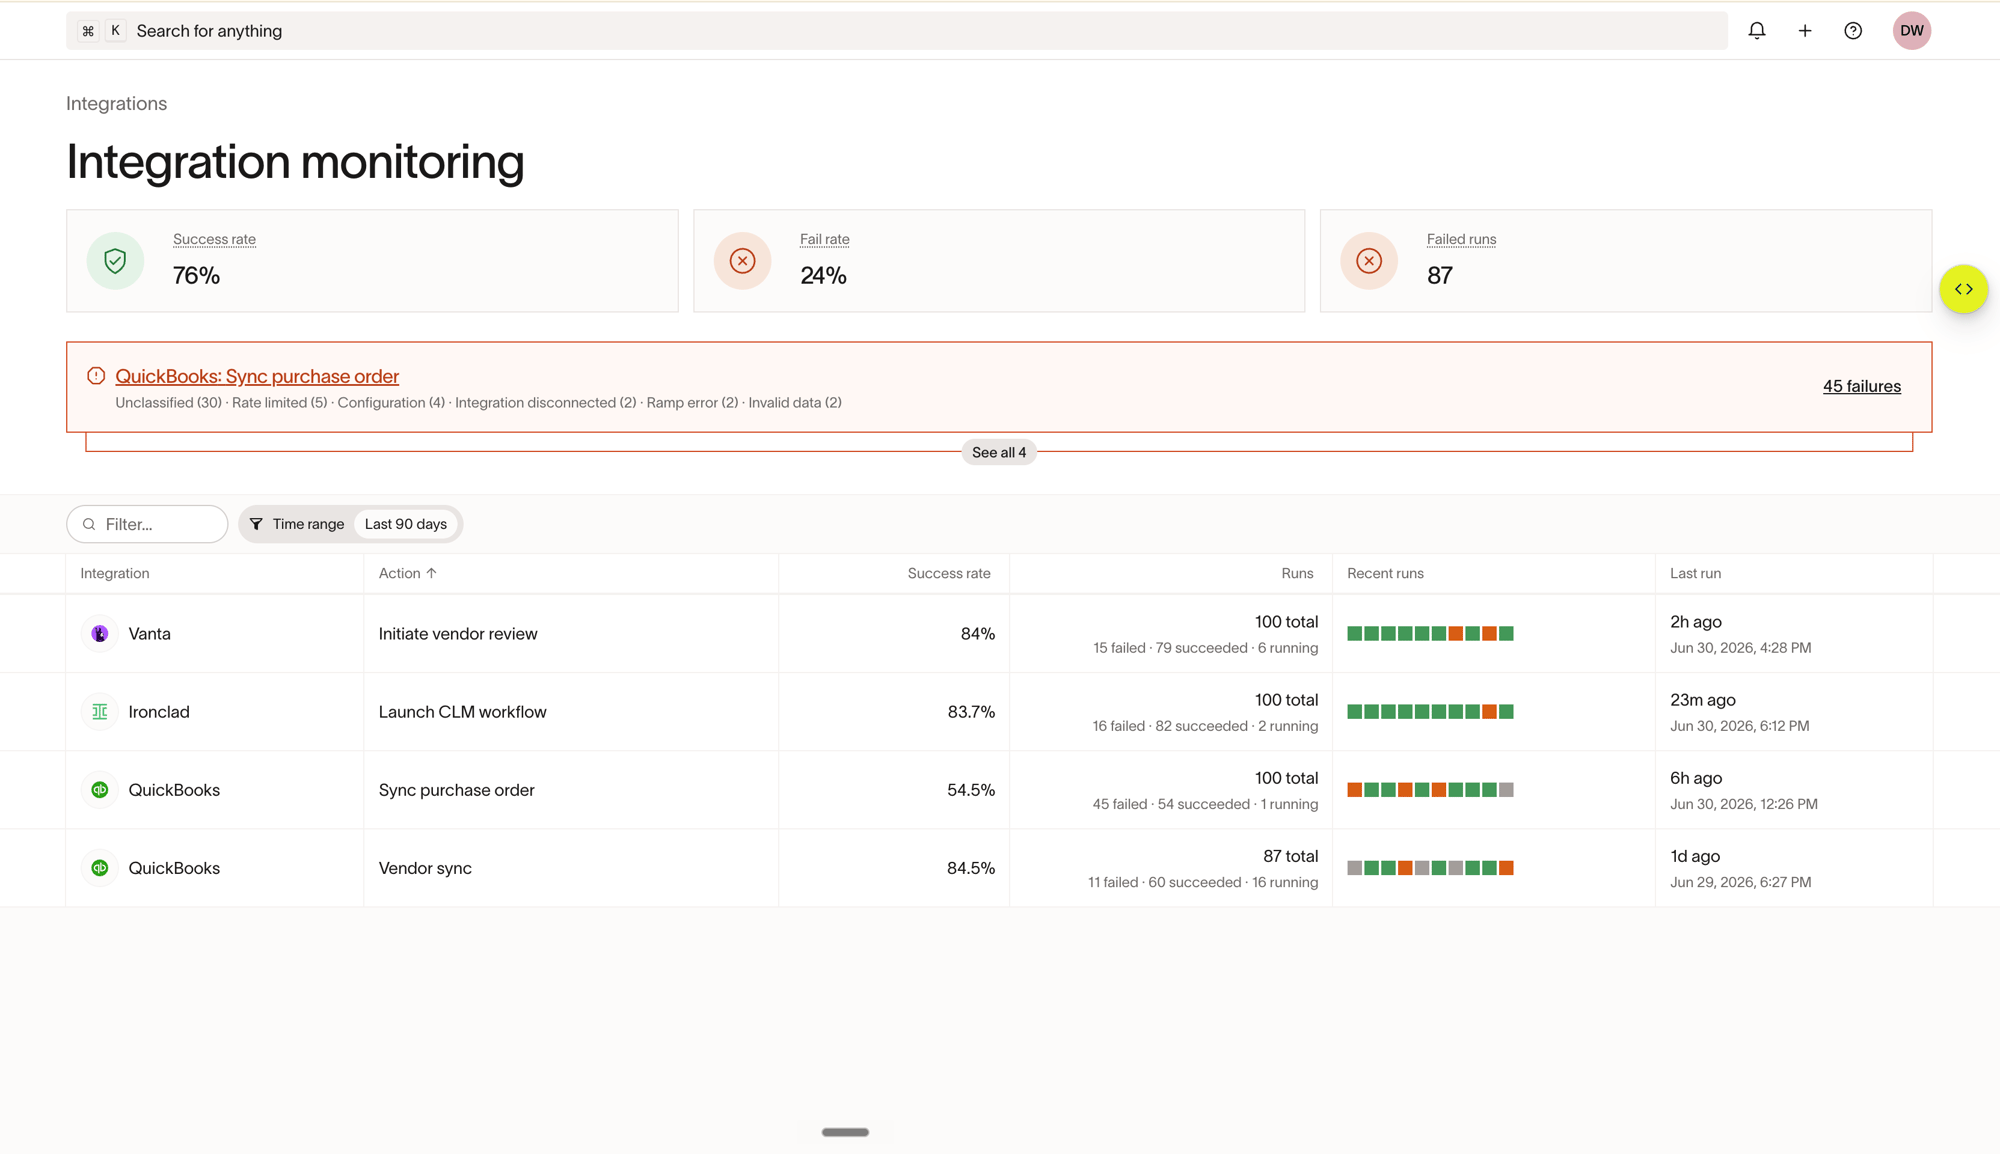
- Health strip — three cards show your success rate, failure rate, and failed run count.
- Needs attention — highlights the integration actions with the most failures so you know where to look first.
- Actions table — every integration action, with the columns below. You can sort it by success rate, run count, or action name.
| Column | What it shows |
|---|---|
| Integration | Connector name and icon (such as Agiloft, Aravo, or Vanta) |
| Action | The action performed (such as create purchase order or initiate vendor review) |
| Success rate | Percentage of successful runs in the selected range |
| Runs | Total runs, broken down into failed, succeeded, and running |
| Recent runs | The last 10 runs as colored status squares |
| Last run | When the action last ran |
Triage a failed run
-
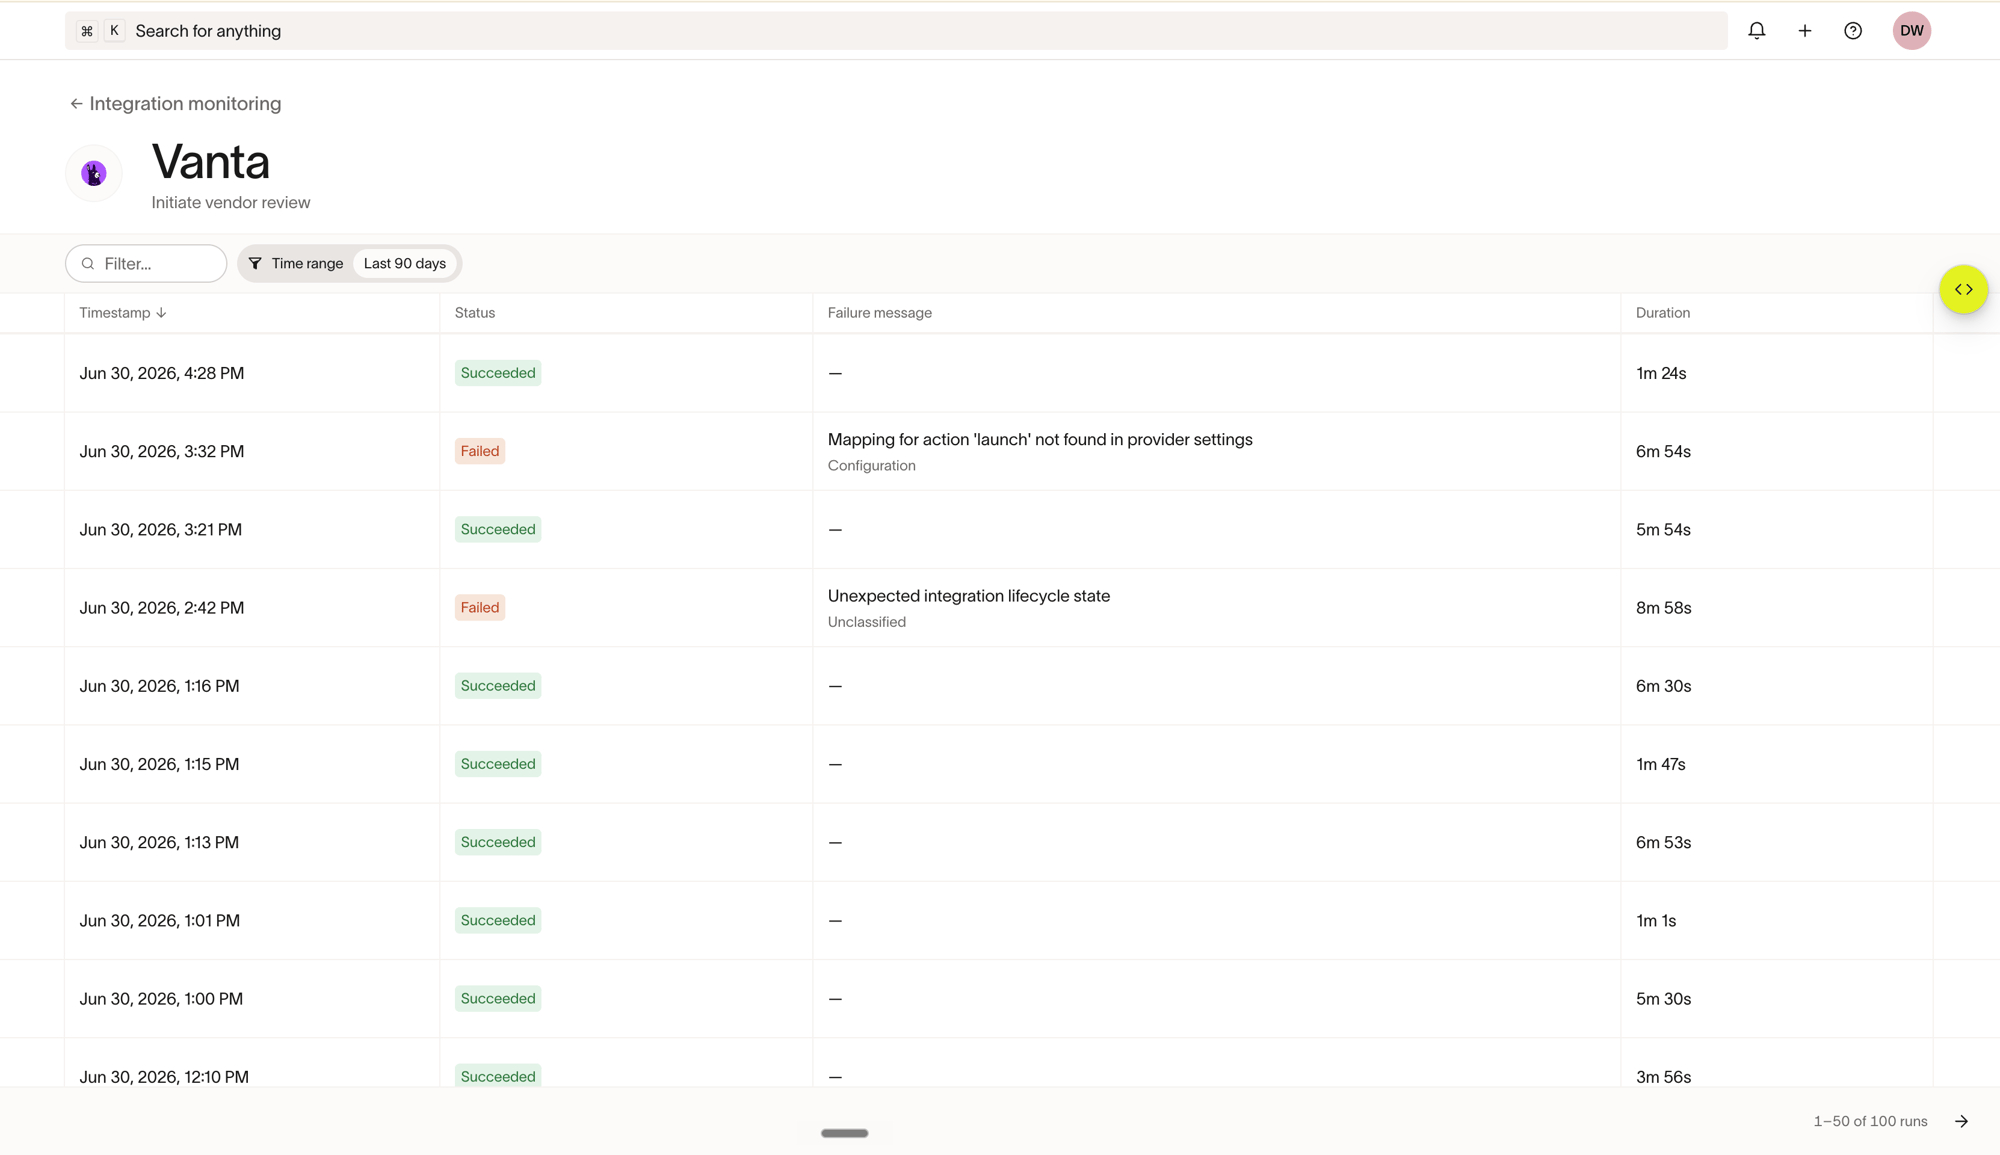
Open an action. From the integration monitoring dashboard, select any action (or one of its recent-run squares) to open its run list — every individual run with its timestamp, status, failure message, error category, and duration.
-
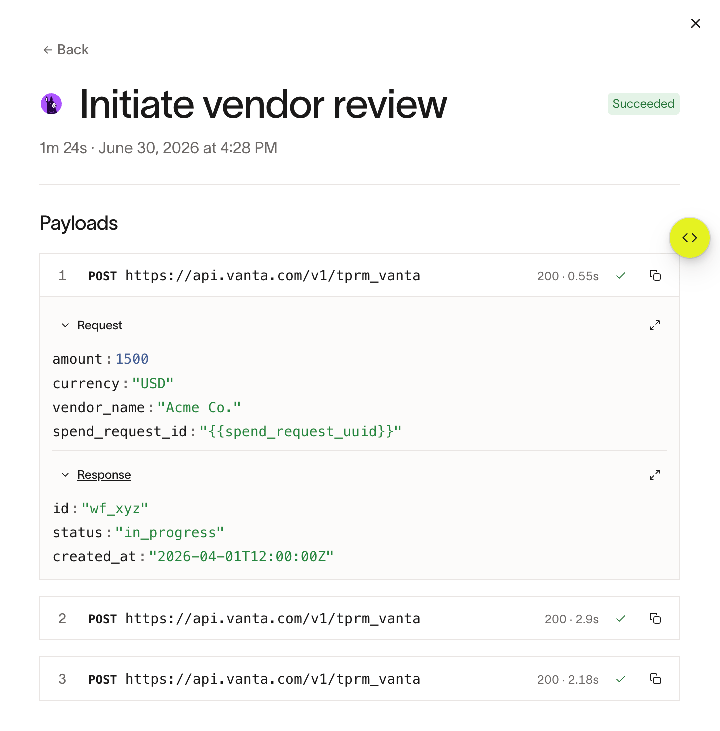
Open a run. Select a run to open the run detail panel, which shows the run's status, duration, start time, and a human-readable failure message when the run failed.
-
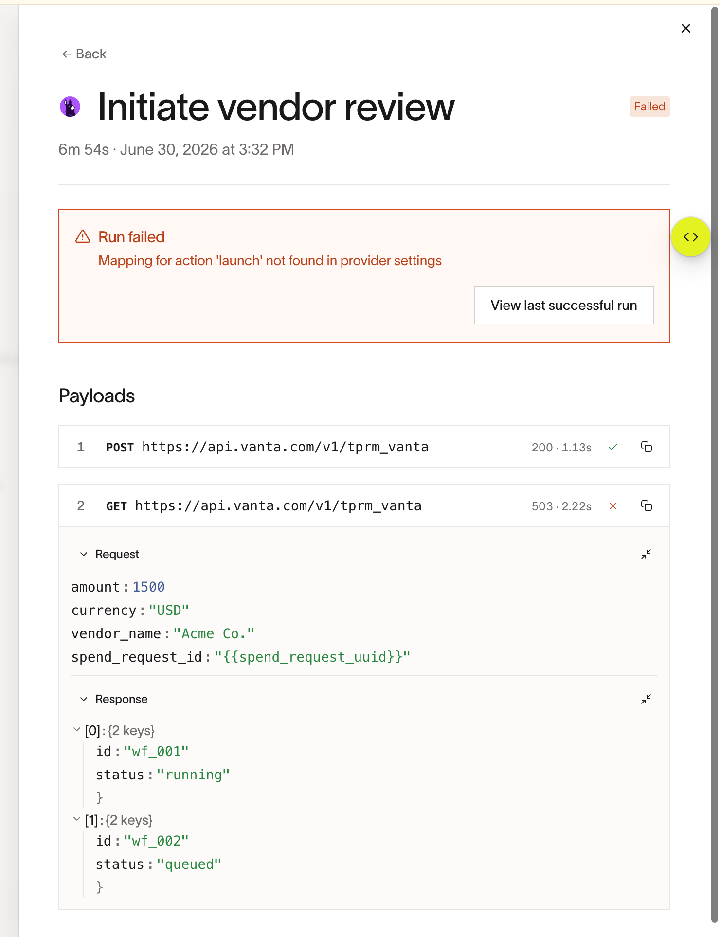
Read the payloads, step by step. For each underlying request, the panel shows the method, URL, response status code, and expandable request and response bodies. The first failed step opens automatically.
When a run fails, the panel shows the error message and a View last successful run action so you can compare the failed run against the most recent success of the same action and spot what changed.
-
Route to the source. From a run, select View spend request to open the originating spend request, View workflow to open the workflow editor focused on the relevant node, or View vendor to open the vendor record.
Note: Payloads pass through a redaction layer before they're displayed. Authentication headers, tokens, API keys, and other secrets are stripped at the source and never shown.
Filter runs
Use filters to narrow what the dashboard shows:
- Time range — last 15 minutes, 1 hour, 4 hours, 24 hours (the default), 7 days, 30 days, or 90 days. You can also set a custom date range.
- Status — failed, succeeded, or in progress.
- Error category — group runs by the type of failure.
- Provider — limit results to a specific integration.